Forecasting Benchmark
This page summarizes the maintained forecasting benchmark artifacts. Lower is
better for RMSE, MAE, WAPE, WRMSSE, RPS, and mean RMSE ratio. A mean RMSE ratio
of 1.000000 means the model tied the best RMSE observed on that artifact and
split.
NYC Taxi Demand
Real taxi demand uses January–April 2024 NYC TLC yellow taxi trips, 24 pickup/dropoff lanes, daily aggregation, and three leakage-safe rolling origins with a 7-day horizon. The maintained artifact compares CartoBoost with functime and external lag-tree baselines under the same protocol.
| Rank | Model | RMSE | MAE | WAPE | Artifact |
|---|---|---|---|---|---|
| 1 | functime_snaive | 77.690688 | 48.091270 | 0.169428 | forecasting_library_benchmark_real.json |
| 2 | cartoboost_auto_forecast | 85.726457 | 50.868085 | 0.177963 | forecasting_library_benchmark_real.json |
| 3 | cartoboost_lag | 88.662817 | 50.014466 | 0.174668 | forecasting_library_benchmark_real.json |
| 4 | lightgbm_lag | 89.462956 | 50.795280 | 0.177978 | forecasting_library_benchmark_real.json |
| 5 | xgboost_lag | 89.670441 | 50.722884 | 0.177666 | forecasting_library_benchmark_real.json |
| 6 | functime_ridge | 100.668198 | 67.930666 | 0.237628 | forecasting_library_benchmark_real.json |
| 7 | functime_lightgbm | 123.966168 | 78.958623 | 0.271460 | forecasting_library_benchmark_real.json |
Read: cartoboost_auto_forecast is 4.18% lower RMSE than the strongest completed
external learned baseline (lightgbm_lag) across the three rolling origins. It
does not beat the seasonal-naive library baseline, so the artifact does not
claim a win against every forecasting library. The external-baseline gate is
recorded directly in the JSON artifact and passes the v0.3 within-5% RMSE rule.
The current run loaded and aggregated 13,069,067 source rows in 2.050 seconds
and completed in 22.379 seconds. It recorded 71.205 CPU-seconds and a 925 MiB
peak resident set; per-fold fit and prediction timings remain in the JSON
artifact.
Reproduce the maintained artifact with:
PYTHONPATH=python uv run --group dev --group bench python scripts/forecasting_library_benchmark.py \
  --source nyc-taxi --year 2024 --months 1,2,3,4 --taxi-type yellow \
  --lanes 24 --horizon 7 --rolling-origin-folds 3 --no-hyperopt \
  --model-roster scalable --cartoboost-n-estimators 48 \
  --cartoboost-auto-n-estimators 48 \
  --no-download \
  --output docs/assets/nyc_taxi_benchmarks/forecasting_library_benchmark_real.json \
  --plot-dir docs/assets/nyc_taxi_benchmarks/forecasting_plots
Comparability audit for forecasting_library_benchmark_real.json: every
requested model completed on the same three rolling-origin folds and 7-day
horizon, uses the same metric set, and records candidate selection without
outer test-label selection. The strongest completed external learned baseline
is lightgbm_lag; CartoBoost's 0.958234 RMSE ratio versus that baseline is
inside the five-percent acceptance gate. The seasonal-naive result remains
reported as a separate, stronger forecasting-library reference.
Synthetic Demand Checks
The synthetic demand artifacts keep taxi-shaped route-demand diagnostics in the benchmark suite. They are not real TLC data.
| Run | Rank | Model | Mean RMSE Ratio | Wins/Ties | Artifact |
|---|---|---|---|---|---|
| CartoBoost sample | 1 | cartoboost_auto_forecast | 1.000000 | 4 | forecasting_overhaul_committed_suite.json |
| Scalable external roster | 1 | cartoboost_auto_forecast | 1.013744 | 3 | forecasting_overhaul_committed_suite_scalable_roster.json |
| Scalable external roster | 3 | lightgbm_lag | 1.279238 | 1 | forecasting_overhaul_committed_suite_scalable_roster.json |
| Generalization guardrail | 1 | cartoboost_auto_forecast | 1.000000 | 4 | forecasting_generalization_scalable_synthetic.json |
| Generalization guardrail | 3 | lightgbm_lag | 1.196396 | 0 | forecasting_generalization_scalable_synthetic.json |
| Generalization guardrail | 4 | xgboost_lag | 1.258816 | 0 | forecasting_generalization_scalable_synthetic.json |
Read: the current scalable synthetic checks favor CartoBoost.
Prophet-Compatible Surface
cartoboost.Prophet provides the familiar ds/y workflow over the Rust
piecewise-linear core. The façade accepts pandas or Polars input, creates
future dataframes, supports Fourier seasonalities, extra regressors, holidays,
intervals, component columns, and predictive-sample access, and returns
Prophet-shaped ds, yhat, yhat_lower, and yhat_upper results.
The matched smoke benchmark uses the same deterministic daily fixture, weekly
seasonality, 30-day horizon, and uncertainty_samples=0. Timings below are
model timings after imports; the upstream Prophet run uses prophet==1.2.2
and converts Polars to pandas, while CartoBoost fits the Polars frame directly.
| Rows | Engine | Input | Fit seconds | Predict seconds | Total seconds | Output rows |
|---|---|---|---|---|---|---|
| 500 | cartoboost.Prophet | Polars | 0.0170 | 0.0052 | 0.0222 | 30 |
| 500 | prophet.Prophet | Polars → pandas | 0.0538 | 0.0037 | 0.0575 | 30 |
| 100,000 | cartoboost.Prophet | Polars | 0.2359 | 0.0098 | 0.2457 | 30 |
| 100,000 | prophet.Prophet | Polars → pandas | 1.8920 | 0.0040 | 1.8960 | 30 |
CartoBoost is 2.6× faster on the 500-row run and 7.7× faster on the 100,000-row run under this single-series protocol. The optimized path avoids serializing historical component rows when the requested forecast is future-only; the native Rust forecast and component calls remain sub-10 ms on the 100,000-row case. These are synthetic performance results, not a quality claim; the functionality claim is covered by the pandas/Polars compatibility test and Prophet-shaped output contract.
Reproduce the rows independently in the two environments:
uv run --group dev python scripts/prophet_surface_benchmark.py --engine cartoboost --rows 500 --input polars
uv run --group dev python scripts/prophet_surface_benchmark.py --engine cartoboost --rows 100000 --input polars
/tmp/prophet-venv/bin/python scripts/prophet_surface_benchmark.py --engine prophet --rows 500 --input polars
/tmp/prophet-venv/bin/python scripts/prophet_surface_benchmark.py --engine prophet --rows 100000 --input polars
The public-method audit compares the 33-method Prophet 1.2.2 surface against the CartoBoost façade and reports missing methods and signatures as JSON:
/tmp/prophet-venv/bin/python scripts/prophet_parity_audit.py --engine prophet > /tmp/prophet-audit-upstream.json
uv run --group dev python scripts/prophet_parity_audit.py --engine cartoboost > /tmp/prophet-audit-cartoboost.json
Both engines report all 33 audited methods present. Numerical Stan posterior parity and MCMC backend parity remain outside this Rust-native deterministic surface; those modes are rejected explicitly by CartoBoost.
Intermittent Demand Checks
The intermittent-demand suite exercises the fixed Croston, SBA, and TSB forecasters on four taxi-shaped synthetic problems with sparse zero-heavy series. It is a library-only roster, so there is no CartoBoost row in this run.
Rerun command:
PYTEST_DISABLE_PLUGIN_AUTOLOAD=1 uv run --no-sync --group dev --group bench python scripts/forecasting_library_benchmark.py \
  --suite \
  --source polars \
  --days 120 \
  --lanes 4 \
  --horizon 7 \
  --suite-folds 2 \
  --model-roster intermittent \
  --no-candidate-selection \
  --no-hyperopt \
  --output target/forecasting_intermittent_suite.json
| Rank | Model | Mean RMSE Ratio | Wins/Ties | Top-3 Finishes |
|---|---|---|---|---|
| 1 | croston | 1.000000 | 4 | 4 |
| 2 | tsb | 1.000020 | 0 | 4 |
| 3 | sba | 1.163766 | 0 | 4 |
Per-problem RMSE:
| Problem | croston | sba | tsb |
|---|---|---|---|
airport_calendar_events | 2.628365 | 3.128337 | 2.628444 |
borough_monthly_pulses | 3.052133 | 3.478771 | 3.052177 |
route_mix_shift | 2.703933 | 3.171921 | 2.703990 |
taxi_weekly | 2.760485 | 3.180032 | 2.760527 |
Read: Croston is the strongest fixed intermittent-demand baseline in this current synthetic taxi-shaped suite, with TSB effectively tied on RMSE and SBA consistently behind both. This is implementation evidence for the intermittent roster path, not a real-data taxi demand claim.
NeuralPanel Lane Split Suite
NeuralPanelForecaster has a dedicated taxi-lane split suite for checking
direct multi-horizon neural behavior under four panel stresses: rolling-origin,
cold-lane, cold-origin, and sparse-tail. The roster is intentionally small:
seasonal_naive, cartoboost_lag, and cartoboost_neural_panel.
Rerun command:
uv run --group dev python scripts/forecasting_library_benchmark.py \
  --source polars \
  --model-roster neural-panel \
  --neural-panel-splits \
  --lanes 36 \
  --days 180 \
  --horizon 14 \
  --suite-folds 1 \
  --output target/neural_panel_taxi_lane_split_suite.json
The JSON artifact records the exact command, split definitions, RMSE/MAE/WAPE metrics, timing, model settings, resource usage, and artifact path. Cold identity splits expand missing-lane forecasts by exact lane when available, then origin, destination, and global horizon means. Treat the suite as implementation evidence until a maintained artifact is committed and summarized with its actual metric table.
CartoBoost Piecewise Local Diagnostics
The piecewise roster runs only CartoBoost's
cartoboost_piecewise_linear_seasonal model. This is the local Prophet-style
tool for trend, changepoints, Fourier seasonality, events, regressors, fitted
artifacts, and component decomposition, surfaced as
piecewise_linear_seasonal in Python and the interactive docs examples.
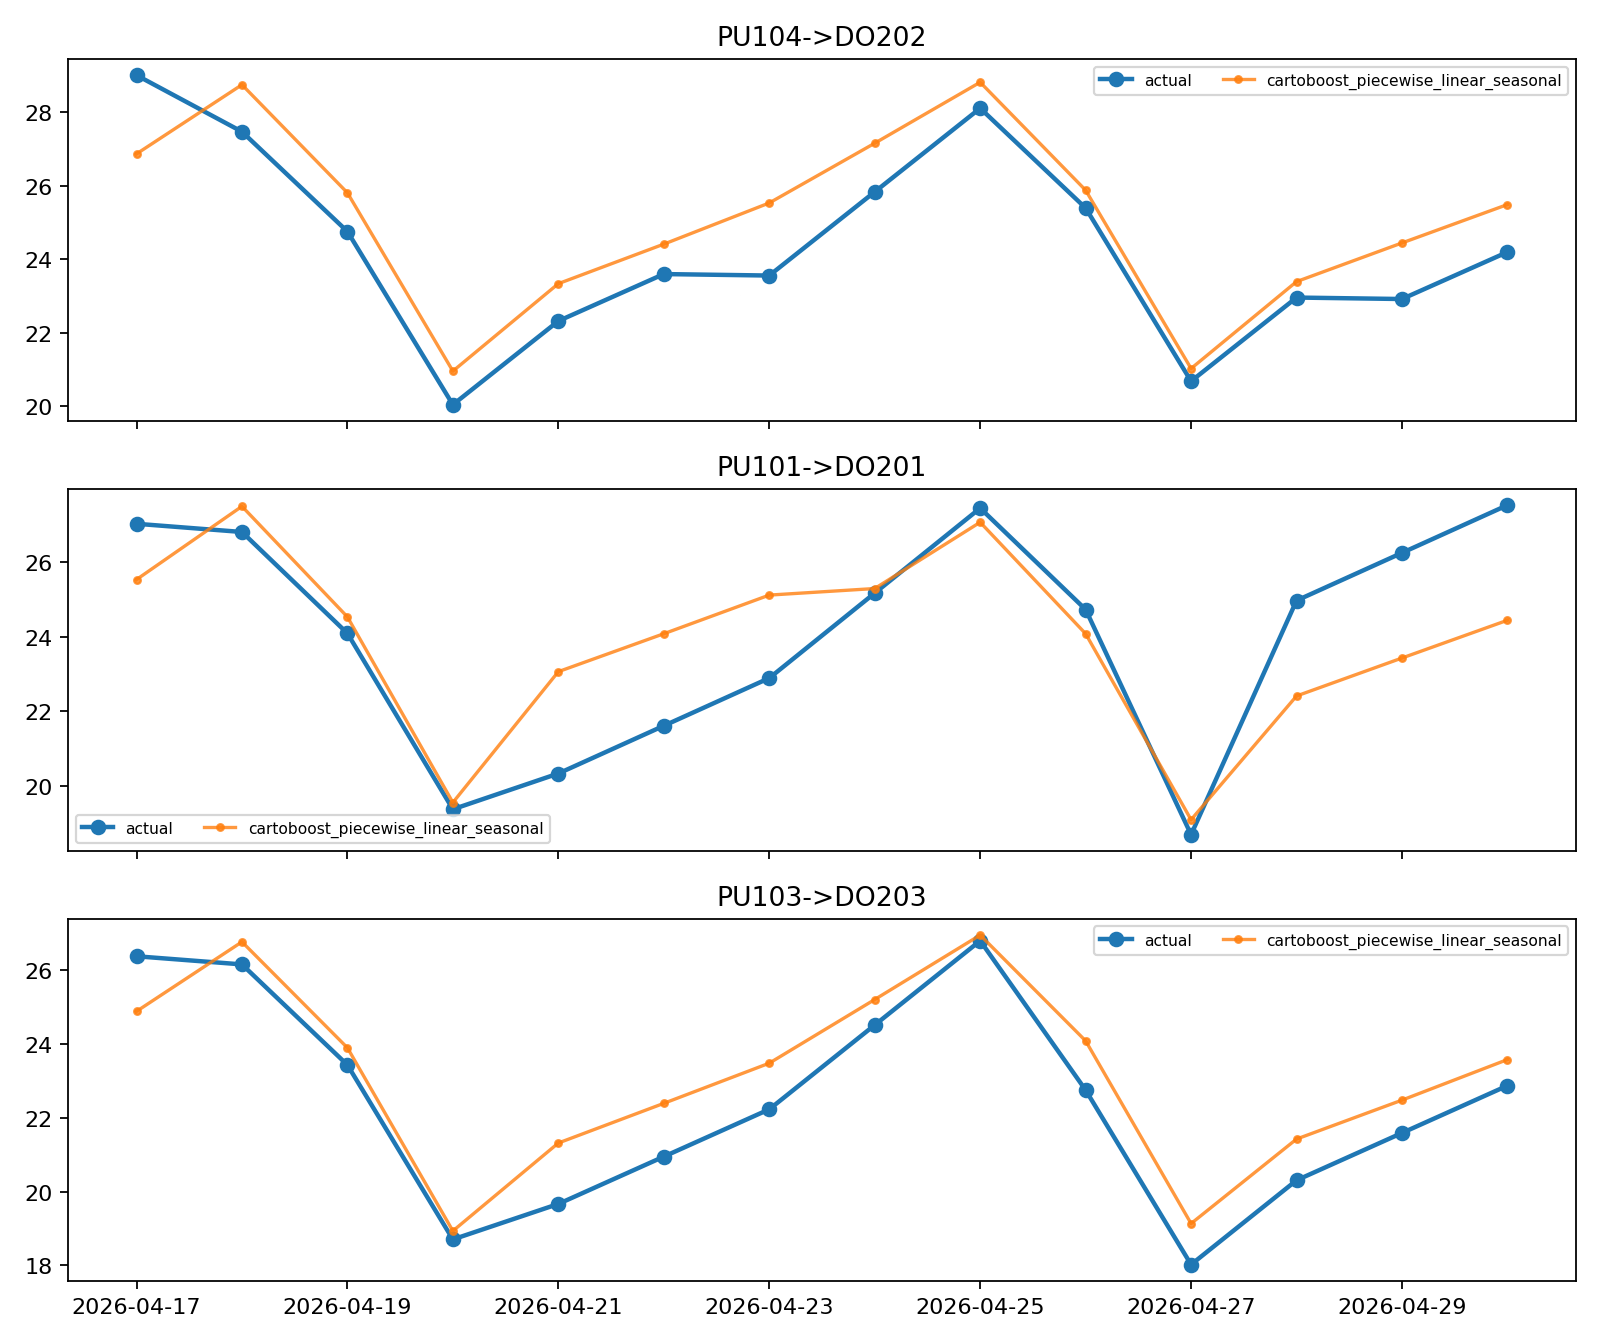
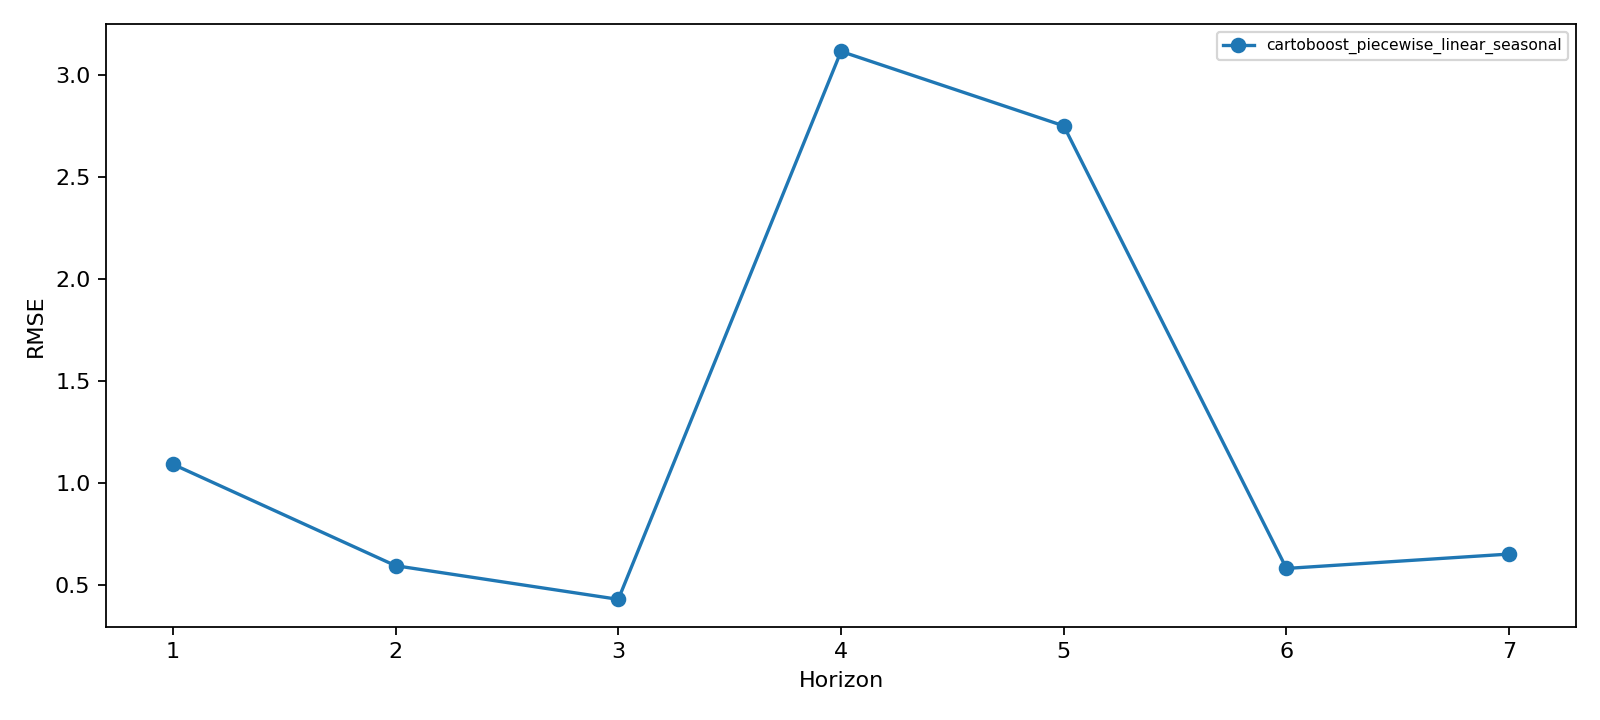
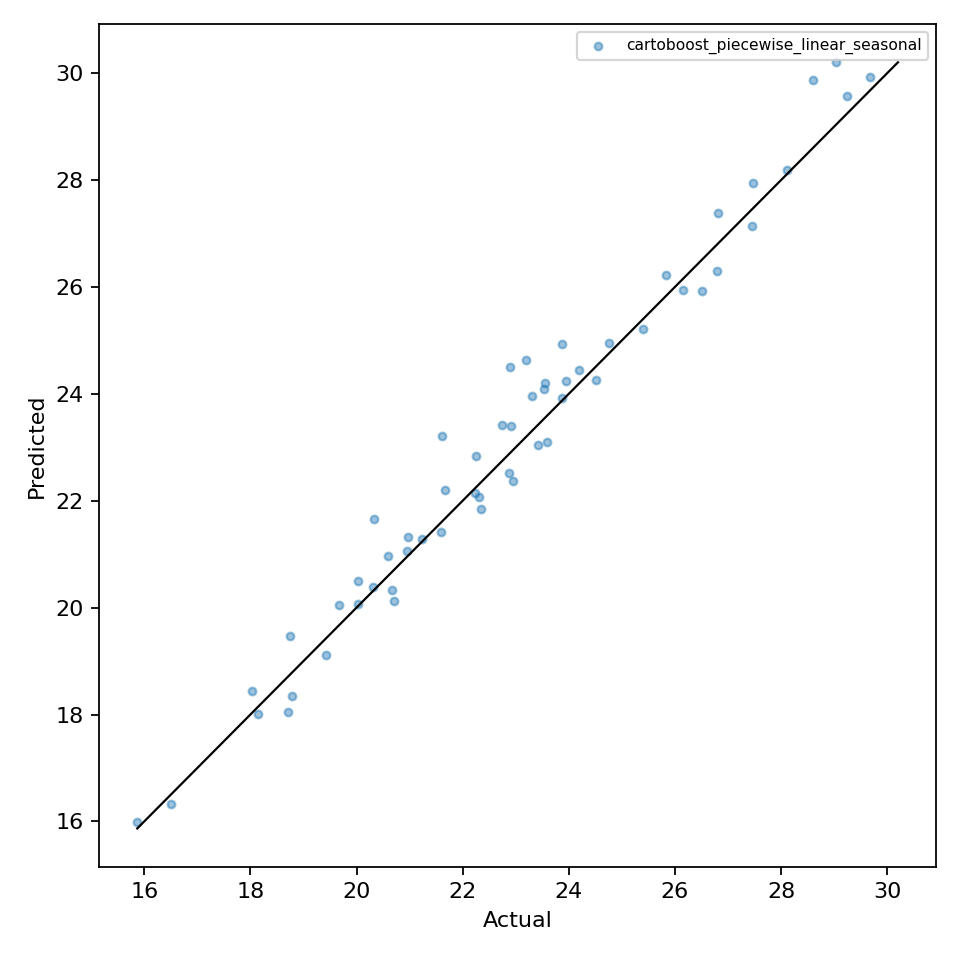
This synthetic suite run uses four taxi-shaped daily demand problem families, 4 pickup/dropoff lanes per problem, 120 daily observations, two rolling-origin folds, and a 7-day horizon. Candidate selection and hyperparameter search are disabled so the plots show the local model behavior directly.
| Problem | Model | RMSE | MAE | WAPE |
|---|---|---|---|---|
airport_calendar_events | cartoboost_piecewise_linear_seasonal | 1.579893 | 0.807465 | 0.035577 |
borough_monthly_pulses | cartoboost_piecewise_linear_seasonal | 2.059026 | 1.517640 | 0.066407 |
route_mix_shift | cartoboost_piecewise_linear_seasonal | 0.603890 | 0.484308 | 0.021195 |
taxi_weekly | cartoboost_piecewise_linear_seasonal | 1.358277 | 1.158468 | 0.050880 |
Read: on these deterministic synthetic Prophet-shaped tasks, the local CartoBoost piecewise model executes the trend, changepoint, and Fourier seasonality path without Stan while preserving the rolling-origin split protocol. This is synthetic evidence for the piecewise linear seasonal implementation path, not a replacement for real taxi or M-series forecasting evidence.
Rendered local CartoBoost piecewise diagnostics:
Rerun command:
PYTEST_DISABLE_PLUGIN_AUTOLOAD=1 uv run --no-sync --group dev --group bench python scripts/forecasting_library_benchmark.py \
  --suite synthetic \
  --source polars \
  --days 120 \
  --lanes 4 \
  --horizon 7 \
  --suite-folds 2 \
  --model-roster piecewise \
  --no-candidate-selection \
  --no-hyperopt \
  --cartoboost-n-estimators 5 \
  --cartoboost-auto-n-estimators 5 \
  --output target/forecasting_piecewise_local_suite.json \
  --plot-dir docs/assets/nyc_taxi_benchmarks/piecewise_local_plots
Spatial Piecewise Kriging Diagnostic
The deterministic spatial_piecewise_kriging_panel check exercises the
Prophet-shaped CartoBoost base with ordinary kriging fusion. It uses 6
pickup/dropoff lanes, 180 daily observations per lane, a 7-day rolling-origin
holdout, fixed model settings, and no hyperparameter search. The split rule is
strictly time ordered: train timestamps end on 2024-06-21 and validation starts
on 2024-06-22.
The roster includes Naive, SeasonalNaive, PiecewiseLinearSeasonal,
KrigingForecaster, and spatial_piecewise_kriging_hybrid under the same split.
The hybrid row uses zone_pressure as a known future spatial regressor and
residual kriging over stable lane coordinates. The artifact also records fit
time, prediction time, model metadata, cutoffs, variogram config, and RMSE/MAE
/ WAPE deltas against piecewise_linear_seasonal and seasonal_naive.
| Model | RMSE | MAE | WAPE | Fit seconds | Predict seconds | RMSE delta vs piecewise |
|---|---|---|---|---|---|---|
cartoboost_lag | 0.045793 | 0.038338 | 0.000633 | 0.353398 | 0.002575 | -1.989170 |
seasonal_naive | 0.949291 | 0.821293 | 0.013561 | 0.001032 | 0.001104 | -1.085673 |
spatial_piecewise_kriging_hybrid | 1.016571 | 0.902431 | 0.014900 | 0.050765 | 0.006882 | -1.018393 |
theta | 1.849915 | 1.661433 | 0.027432 | 0.002872 | 0.001364 | -0.185048 |
weighted_ensemble | 1.910406 | 1.690188 | 0.027907 | 0.003623 | 0.001746 | -0.124558 |
piecewise_linear_seasonal | 2.034964 | 1.843295 | 0.030435 | 0.009016 | 0.002114 | 0.000000 |
optimized_theta | 2.142322 | 1.762496 | 0.029101 | 0.026523 | 0.001979 | 0.107359 |
kriging | 2.237221 | 1.857257 | 0.030666 | 0.002341 | 0.001685 | 0.202257 |
naive | 2.237221 | 1.857259 | 0.030666 | 0.001030 | 0.001261 | 0.202258 |
Read: the hybrid improves RMSE, MAE, and WAPE versus the base
piecewise_linear_seasonal row by using the kriged zone_pressure regressor
and residual correction on this synthetic spatial residual task. It is not the
best row overall: cartoboost_lag and seasonal_naive are stronger on this
deterministic panel. Treat the run as implementation and leakage-check evidence
for spatial fusion, not as a production taxi-demand quality claim.
Rerun command:
uv run --group dev python scripts/forecasting_benchmark.py \
  --days 180 \
  --horizon 7 \
  --folds 1 \
  --panel-series 6 \
  --output target/spatial_piecewise_kriging_benchmark.json
The run above writes target/spatial_piecewise_kriging_benchmark.json.
M4 Sample
The current M4 sample scores the first 96 series from each M4 frequency group. It is a sample, not a full M4 corpus result.
| Rank | Model | Mean RMSE Ratio | Wins/Ties | Top-3 Finishes | Artifact |
|---|---|---|---|---|---|
| 1 | cartoboost_auto_forecast | 1.000000 | 6 | 6 | forecasting_overhaul_m4_committed.json |
| 2 | cartoboost_lag | 12.104570 | 3 | 6 | forecasting_overhaul_m4_committed.json |
Read: cartoboost_auto_forecast wins or ties all six M4 sample groups on this
artifact.
M5 Demand Forecasting
The M5 table reports current-code CartoBoost models against external baselines. The 100-series comparison uses the public M5 files and a full external roster. The full-corpus fast check covers all 30,490 bottom-level item-store series with the fast CartoBoost roster.
| Run | Rank | Model | RMSE | MAE | WAPE | WRMSSE | Artifact |
|---|---|---|---|---|---|---|---|
| Sample | 1 | cartoboost_auto_forecast | 2.415225 | 1.139285 | 0.910615 | 0.568942 | forecasting_overhaul_m5_committed.json |
| Sample | 2 | cartoboost_lag | 2.540625 | 1.219927 | 0.975071 | 0.743721 | forecasting_overhaul_m5_committed.json |
| 100-series comparison | 1 | cartoboost_auto_forecast | 2.511292 | 1.135585 | 0.916059 | 0.669928 | forecasting_m5_full_roster_sample.json |
| 100-series comparison | 2 | statsforecast_autoets | 2.525734 | 1.141999 | 0.921232 | 0.717426 | forecasting_m5_full_roster_sample.json |
| 100-series comparison | 3 | statsforecast_dynamic_optimized_theta | 2.556517 | 1.163750 | 0.938779 | 0.712698 | forecasting_m5_full_roster_sample.json |
| 100-series comparison | 4 | statsforecast_autotbats | 2.602055 | 1.156588 | 0.933001 | 0.618397 | forecasting_m5_full_roster_sample.json |
| 100-series comparison | 5 | functime_ridge | 2.606775 | 1.207878 | 0.974376 | 0.711331 | forecasting_m5_full_roster_sample.json |
| 100-series comparison | 6 | statsforecast_autotheta | 2.607077 | 1.196042 | 0.964828 | 0.723187 | forecasting_m5_full_roster_sample.json |
| 100-series comparison | 7 | statsforecast_autoarima | 2.655754 | 1.194312 | 0.963433 | 0.739778 | forecasting_m5_full_roster_sample.json |
| 100-series comparison | 8 | xgboost_lag | 2.793477 | 1.500446 | 1.210386 | 1.249158 | forecasting_m5_full_roster_sample.json |
| 100-series comparison | 9 | cartoboost_lag | 2.805543 | 1.285725 | 1.037173 | 0.827678 | forecasting_m5_full_roster_sample.json |
| 100-series comparison | 10 | statsforecast_autoces | 2.818083 | 1.228058 | 0.990655 | 0.630302 | forecasting_m5_full_roster_sample.json |
| 100-series comparison | 11 | lightgbm_lag | 2.825295 | 1.253991 | 1.011575 | 1.000983 | forecasting_m5_full_roster_sample.json |
| 100-series comparison | 12 | functime_snaive | 3.286281 | 1.337500 | 1.078940 | 0.825078 | forecasting_m5_full_roster_sample.json |
| 100-series comparison | 12 | statsforecast_seasonal_naive | 3.286281 | 1.337500 | 1.078940 | 0.825078 | forecasting_m5_full_roster_sample.json |
| 100-series comparison | 14 | functime_lightgbm | 3.342214 | 1.379177 | 1.112560 | 0.982476 | forecasting_m5_full_roster_sample.json |
| 100-series comparison | 15 | prophet_additive | 14.960959 | 6.146700 | 4.958444 | 3.366280 | forecasting_m5_full_roster_sample.json |
| Full-corpus fast check | 1 | cartoboost_lag | 2.634879 | 1.332997 | 0.923884 | n/a | forecasting_m5_full.json |
Read: cartoboost_auto_forecast is first by RMSE on the sample and 100-series
M5 comparison. AutoTBATS is first by WRMSSE on the 100-series comparison.
M6 Daily Returns
The M6 artifacts are daily-return forecasting proxies with five-bucket rank probabilities. They are not official M6 submission files.
| Run | Rank | Model | RMSE | MAE | WAPE | RPS | Artifact |
|---|---|---|---|---|---|---|---|
| Sample | 1 | cartoboost_auto_forecast | 0.013439 | 0.007342 | 1.000000 | 0.208171 | forecasting_overhaul_m6_committed.json |
| Sample | 2 | cartoboost_lag | 0.014440 | 0.009290 | 1.265338 | 0.200754 | forecasting_overhaul_m6_committed.json |
| 100-symbol comparison | 1 | cartoboost_auto_forecast | 0.013392 | 0.007357 | 1.000000 | 0.206007 | forecasting_m6_full.json |
| 100-symbol comparison | 2 | statsforecast_autoarima | 0.013402 | 0.007400 | 1.005844 | 0.200029 | forecasting_m6_full.json |
| 100-symbol comparison | 3 | statsforecast_autoets | 0.013408 | 0.007456 | 1.013524 | 0.198295 | forecasting_m6_full.json |
| 100-symbol comparison | 4 | functime_ridge | 0.013474 | 0.007670 | 1.042553 | 0.198198 | forecasting_m6_full.json |
| 100-symbol comparison | 5 | statsforecast_autotbats | 0.013477 | 0.007663 | 1.041580 | 0.200969 | forecasting_m6_full.json |
| 100-symbol comparison | 6 | statsforecast_autoces | 0.013522 | 0.007617 | 1.035289 | 0.198260 | forecasting_m6_full.json |
| 100-symbol comparison | 7 | statsforecast_dynamic_optimized_theta | 0.013669 | 0.008204 | 1.115187 | 0.199984 | forecasting_m6_full.json |
| 100-symbol comparison | 8 | statsforecast_autotheta | 0.013683 | 0.008228 | 1.118462 | 0.197417 | forecasting_m6_full.json |
| 100-symbol comparison | 9 | xgboost_lag | 0.014246 | 0.008896 | 1.209160 | 0.199529 | forecasting_m6_full.json |
| 100-symbol comparison | 10 | cartoboost_lag | 0.014348 | 0.009357 | 1.271868 | 0.204266 | forecasting_m6_full.json |
| 100-symbol comparison | 11 | lightgbm_lag | 0.016087 | 0.010955 | 1.489135 | 0.200887 | forecasting_m6_full.json |
| 100-symbol comparison | 12 | prophet_additive | 0.017417 | 0.011750 | 1.597096 | 0.197646 | forecasting_m6_full.json |
| 100-symbol comparison | 13 | functime_lightgbm | 0.017474 | 0.011163 | 1.517349 | 0.198504 | forecasting_m6_full.json |
| 100-symbol comparison | 14 | functime_snaive | 0.017846 | 0.010780 | 1.465315 | 0.192195 | forecasting_m6_full.json |
| 100-symbol comparison | 14 | statsforecast_seasonal_naive | 0.017846 | 0.010780 | 1.465315 | 0.192195 | forecasting_m6_full.json |
Read: cartoboost_auto_forecast is first by RMSE on the sample and
100-symbol M6 artifact. Seasonal-naive baselines are first by RPS on the
100-symbol comparison.
Reproduce
uv run --group dev python scripts/forecasting_library_benchmark.py \
  --source nyc-taxi \
  --year 2024 \
  --months 1,2,3,4 \
  --taxi-type yellow \
  --lanes 24 \
  --horizon 7 \
  --rolling-origin-folds 3 \
  --no-download \
  --no-hyperopt \
  --model-roster scalable \
  --cartoboost-n-estimators 48 \
  --cartoboost-auto-n-estimators 48 \
  --output docs/assets/nyc_taxi_benchmarks/forecasting_library_benchmark_real.json \
  --plot-dir docs/assets/nyc_taxi_benchmarks/forecasting_plots

uv run --group dev python scripts/forecasting_library_benchmark.py \
  --suite committed \
  --no-hyperopt \
  --model-roster cartoboost \
  --no-candidate-selection \
  --output docs/assets/nyc_taxi_benchmarks/forecasting_overhaul_committed_suite.json

uv run --group dev python scripts/forecasting_generalization.py \
  --compact \
  --no-hyperopt \
  --output docs/assets/nyc_taxi_benchmarks/forecasting_generalization_scalable_synthetic.json

PYTEST_DISABLE_PLUGIN_AUTOLOAD=1 uv run --no-sync --group dev --group bench python scripts/forecasting_library_benchmark.py \
  --suite synthetic \
  --source polars \
  --days 120 \
  --lanes 4 \
  --horizon 7 \
  --suite-folds 2 \
  --model-roster piecewise \
  --no-candidate-selection \
  --no-hyperopt \
  --cartoboost-n-estimators 5 \
  --cartoboost-auto-n-estimators 5 \
  --output target/forecasting_piecewise_local_suite.json \
  --plot-dir docs/assets/nyc_taxi_benchmarks/piecewise_local_plots

uv run --group dev python scripts/forecasting_m4.py \
  --committed \
  --no-hyperopt \
  --output docs/assets/nyc_taxi_benchmarks/forecasting_overhaul_m4_committed.json

uv run --group dev --group bench python scripts/forecasting_m5.py \
  --committed \
  --official-wrmsse \
  --no-hyperopt \
  --output docs/assets/nyc_taxi_benchmarks/forecasting_overhaul_m5_committed.json

uv run --group dev --group bench python scripts/forecasting_m6.py \
  --committed \
  --official-style \
  --no-hyperopt \
  --output docs/assets/nyc_taxi_benchmarks/forecasting_overhaul_m6_committed.json
Larger comparison runs:
uv run --group dev --group bench python scripts/forecasting_library_benchmark.py \
  --source m5 \
  --model-roster full \
  --m5-data-dir data/forecasting_benchmarks/m5 \
  --m5-series-limit 100 \
  --m5-history-days 90 \
  --no-hyperopt \
  --output docs/assets/nyc_taxi_benchmarks/forecasting_m5_full_roster_sample.json \
  --plot-dir docs/assets/nyc_taxi_benchmarks/forecasting_m5_full_roster_plots

uv run --group dev --group bench python scripts/forecasting_library_benchmark.py \
  --source m6 \
  --model-roster full \
  --m6-assets-path data/forecasting_benchmarks/m6/assets_m6.csv \
  --m6-series-limit 0 \
  --m6-horizon 28 \
  --no-hyperopt \
  --output docs/assets/nyc_taxi_benchmarks/forecasting_m6_full.json \
  --plot-dir docs/assets/nyc_taxi_benchmarks/forecasting_m6_full_plots
Limits
- Real taxi demand covers January–April 2024, 24 lanes, and three 7-day rolling-origin folds.
- Synthetic demand checks are diagnostics.
- The CartoBoost piecewise local diagnostics are synthetic and should be read as wiring and behavior evidence for Prophet-shaped tasks, not broad real-data evidence.
- M4 is a 96-series-per-group sample.
- M5 full-roster evidence is a 100-series sample; the full-corpus artifact is a lag-only coverage run.
- M6 is a daily-return proxy, not an official leaderboard submission.
- Optional external baselines require their benchmark extras.